Seasonal Event Cycles Influencing Metrics Across Multi-State Gambling Platforms
Written by Katja Wagner · Aug 19, 2026
Seasonal Event Cycles Influencing Metrics Across Multi-State Gambling Platforms
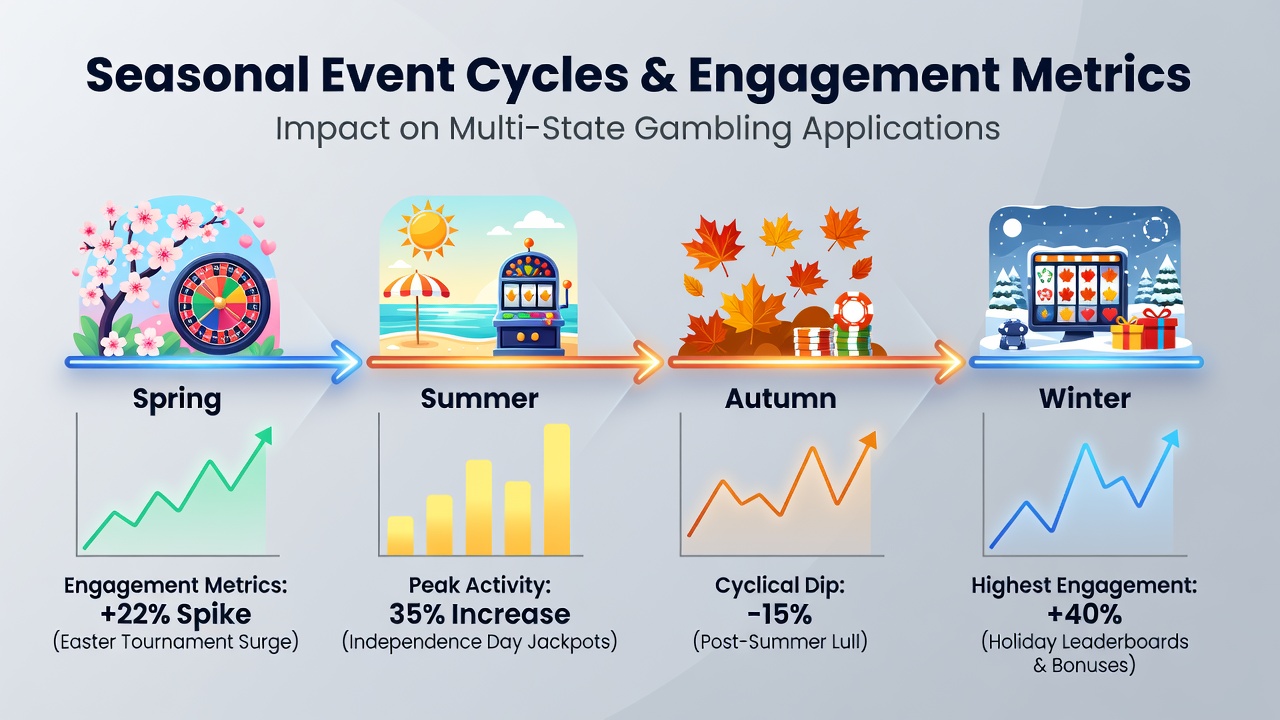
Seasonal event cycles create measurable shifts in user activity within multi-state gambling applications as operators adjust promotions and game offerings to align with holidays, sports calendars, and weather patterns that affect daily routines. Data collected across regulated markets in 2025 and early 2026 shows consistent rises in session length and deposit frequency during summer months and major holiday windows, while quieter periods such as early fall often register declines unless offset by targeted events.
Analysts tracking platforms licensed in multiple jurisdictions note that summer vacations increase mobile usage because players spend more time away from fixed schedules, leading to higher afternoon and evening logins compared to winter baselines. In August 2026, several operators reported sustained activity from ongoing baseball seasons and back-to-school promotions that introduced limited-time tournaments, keeping engagement levels above the post-July dip observed in prior years.
Key Seasonal Drivers of Activity
Holiday periods generate the clearest spikes because platforms introduce themed bonuses, new game releases, and leaderboard challenges that reward consecutive days of play. Research from industry reports indicates deposit volumes climb between 15 and 30 percent during Thanksgiving through New Year windows, while March Madness brackets produce similar lifts in states where sports betting integrates directly with casino-style apps.
Sports calendars also shape patterns because overlapping seasons extend peak windows. Football, basketball, and baseball create rolling engagement opportunities that operators exploit through cross-promotions, and data shows users who participate in one sport often extend sessions into table games or slots when live events conclude. Weather-related cycles add another layer since extreme heat or storms drive indoor time, increasing weekday afternoon traffic in southern states while northern regions see gains during winter storm alerts.
Measured Effects on Engagement Metrics
Retention rates improve when seasonal events include daily login rewards or streak multipliers, according to figures released by state regulatory bodies. Average session duration extends by 8 to 12 minutes during these campaigns, and repeat visit frequency rises because limited-time mechanics encourage users to return before offers expire. Multi-state operators benefit further because players in one jurisdiction can access the same event calendar across different licenses, creating unified engagement curves rather than fragmented state-by-state results.
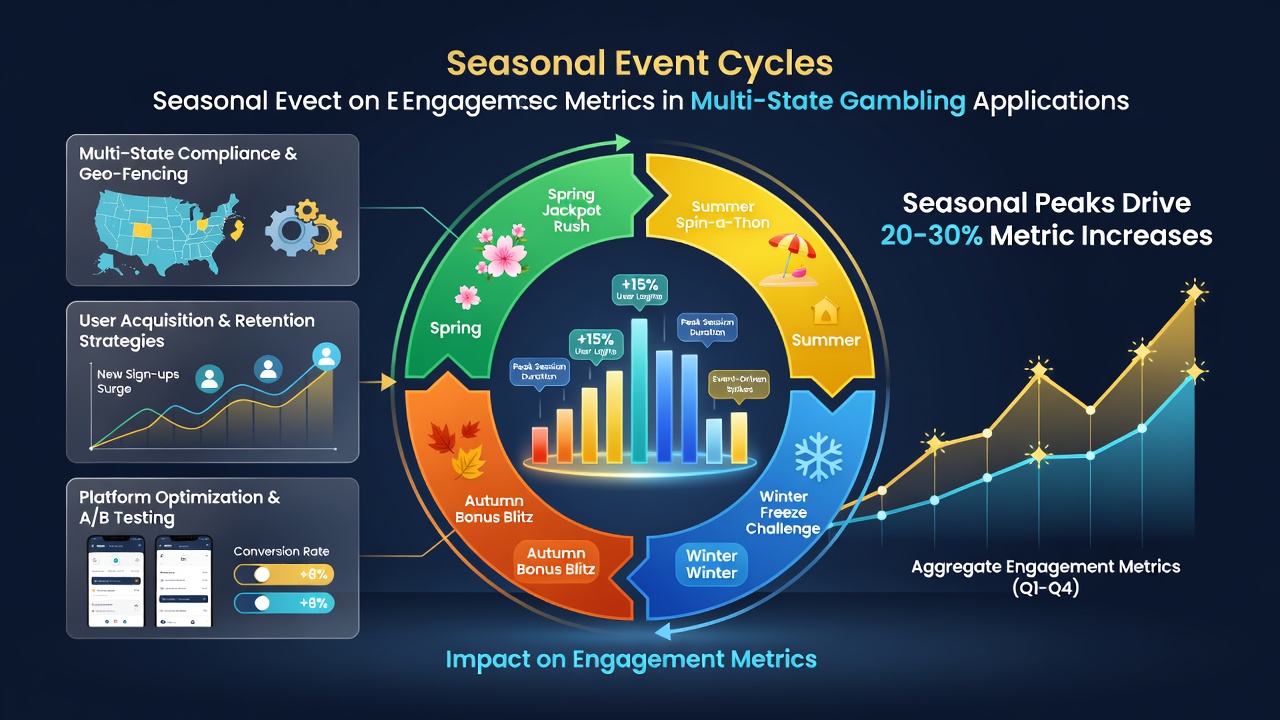
Revenue per active user follows similar seasonal contours, with summer and holiday peaks offsetting slower months. Operators who coordinate event timing across states achieve more stable overall metrics because regional dips in one area get balanced by activity elsewhere, reducing volatility in monthly reporting. Those who studied platform data over multiple years observe that events tied to cultural moments, such as Cinco de Mayo or Independence Day, produce stronger cross-state participation than generic seasonal themes alone.
Regional Variations and Platform Adjustments
States with mature markets like New Jersey and Pennsylvania display tighter alignment between national holidays and engagement spikes, whereas newer markets show more variable responses until user bases mature. Canadian provincial operators report parallel patterns around national holidays and winter sports, demonstrating that seasonal effects transcend single-country boundaries when platforms operate under comparable regulatory frameworks.
Operators respond by shifting marketing spend and game rotation schedules, loading summer-focused titles earlier and preparing fall sports tie-ins well in advance. This preparation helps maintain consistent daily active user counts even when external factors like school schedules reduce evening availability for certain demographics. Reports from the American Gaming Association highlight how coordinated event planning across jurisdictions supports steadier revenue streams despite varying state tax rates and player demographics.
Longer-Term Patterns and Data Sources
Multi-year analyses reveal that seasonal cycles compound when combined with major sporting events or economic shifts, producing larger deviations than isolated holidays. Academic studies from institutions examining digital entertainment consumption confirm that leisure time availability remains the primary driver, while bonus structures amplify the base effect. Platforms that publish transparent metrics allow regulators and researchers to track these relationships more precisely, supporting evidence-based adjustments to responsible gaming tools during high-engagement windows.
Additional context comes from international comparisons, including data shared by Australian regulatory sources and research groups tracking online play in European markets, which show comparable holiday-driven increases when adjusted for local calendars. These parallels help multi-state operators anticipate demand without relying solely on domestic figures.
Conclusion
Seasonal event cycles continue to shape engagement metrics in measurable ways across multi-state gambling applications, with clear peaks during holidays and sports seasons offset by quieter intervals that operators address through targeted promotions. Data from regulatory filings and industry analyses demonstrate consistent patterns that allow platforms to plan resource allocation and feature releases more effectively. As additional states expand legal frameworks, these cyclical influences are expected to remain central to performance tracking and operational strategy.